Note
Click here to download the full example code
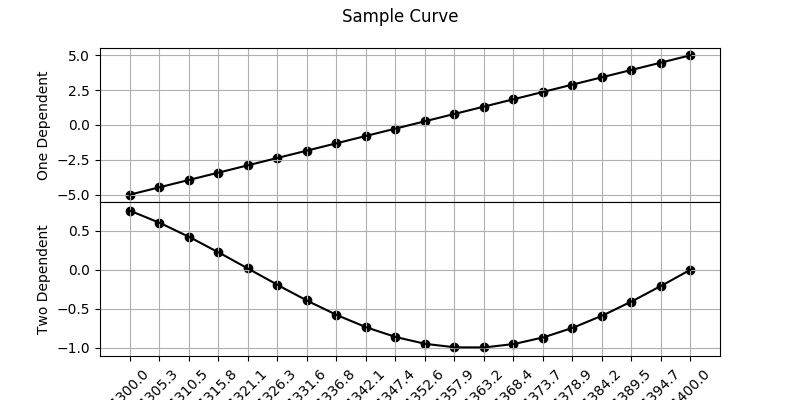
Simple Curve Plot
import attune
import numpy as np

d0 = attune.Dependent(np.linspace(-5, 5, 20), "One Dependent")
d1 = attune.Dependent(np.sin(np.linspace(-4, 0, 20)), "Two Dependent")
s = attune.Setpoints(np.linspace(1300, 1400, 20), "Some Setpoints", "wn")
c = attune.Curve(s, [d0, d1], "Sample Curve")

c.plot()
Total running time of the script: ( 0 minutes 0.300 seconds)